Dry van and
refrigerated ("reefer") van freight increased by 33 percent and 27
percent, respectively, but flatbed freight volume slipped 13 percent
compared to September 2015. Flatbed volume
has declined on a year-over-year basis for the past 15 months, due to a
downturn in economic sectors, such as oil and gas, that produce flatbed
freight.
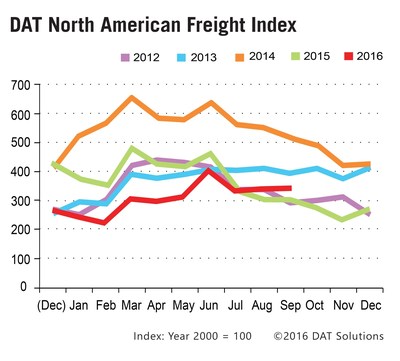
Month-over-month, spot market freight
volume edged up 0.6 percent to the second-highest level this year. This
is an atypical seasonal pattern; September volume declined month over
month in eight of the previous ten years. A 2.7 percent increase in van
freight volume was responsible for the month-over-month growth, as
reefer volume dipped 1.1 percent, and flatbeds lost 1.9 percent in
September, compared to August.
Van Rates Rise from August to September
The increase in van
freight volume boosted spot market rates by 1.4 percent, and reefer
rates added 0.6 percent, month over month. September flatbed rates
declined 1.2 percent compared to August, however, in a common seasonal
pattern.
On a year-over-year
basis, the average line haul rate fell 6.0 percent for vans, 4.5
percent for reefers, and 7.8 percent for flatbeds, compared to September 2015.
The average fuel surcharge, a component of the total rate paid to
carriers, fell 9.1 percent year over year, deepening the decline in
carriers' total revenue per mile. The surcharge is pegged to the retail
price of diesel fuel.
Established in 1978, DAT operates a network of load boards serving intermediaries and carriers across North America. For more than a decade DAT has published its Freight Index, which is representative of the dynamic spot market.
Reference rates are the averages, by equipment type, based on $28 billion
of actual transactions between freight brokers and carriers, as
recorded in DAT RateView. Rates are cited for line haul only, except
where noted. Beginning in January 2015,
the DAT Freight Index was rebased so that 100 on the Index represents
the average monthly volume in the year 2000. Additional trends and
analysis are available at DAT Trendlines.
About DAT Solutions
DAT operates the largest spot freight marketplace in North America.
Transportation brokers, carriers, news organizations and industry
analysts rely on DAT for market trends and data insights derived from
100 million annual freight matches and a database of $28 billion
of market transactions. Related services include a comprehensive
directory of companies with business history, credit, safety, insurance
and company reviews; broker transportation management software;
authority, fuel tax, mileage, vehicle licensing, and registration
services; and carrier onboarding.
Founded in 1978, DAT Solutions, LLC is a wholly owned subsidiary of Roper Technologies (NYSE: ROP), a diversified technology company and constituent of the S&P 500, Fortune 1000 and Russell 1000 indices. www.DAT.com
Good report from DAT I thought I'd share. Want to learn to be a freight broker? It is a good time. Give me a call. 214-206-1169.
Moving forward,
Jeff Roach
www.brooketraining.com

No comments:
Post a Comment